
Gasoline Prices, Then and Now
Angular Views on ... Prices

Whenever the talk among consumers – specifically, drivers – turns to inflation, you can bet that a string of angry words (if not expletives) is headed toward your ears next. “Why, I was only paying a buck a gallon back in 1990" (or 2005, or 2015, or whatever year pops into the complainer’s mind).
Is that irritable claim true? And even if it is, how relevant is that critic’s statement?
All too often, the complainers fail to consider those gasoline prices in relation to family incomes. Or, they simply underestimate the amount they were forking over for a gallon of gas in a given year.
Let’s take a look at the progression of gasoline prices in the U.S. over the past near-century or so, compared to the growth in household incomes during the same period. Along the way, we’ll also consider the difference between “current dollar” prices (the amount in cash that a motorist actually paid to purchase a gallon of gasoline at a service station in a given year), versus “current dollar” equivalents (how much that actual price paid would be equivalent to, in current (say, 2023) dollars.
In 1929, the year of the Great Depression that would linger through the 1930s, the driver of a Ford Model A – the company’s recently-introduced replacement for the fabled Model T – could expect to pay around 21 cents for a gallon of gasoline. Two years later, the average price dipped to a low point: just 17 cents. Through the Thirties, the average price remained stable: between 18 and 20 cents per gallon.
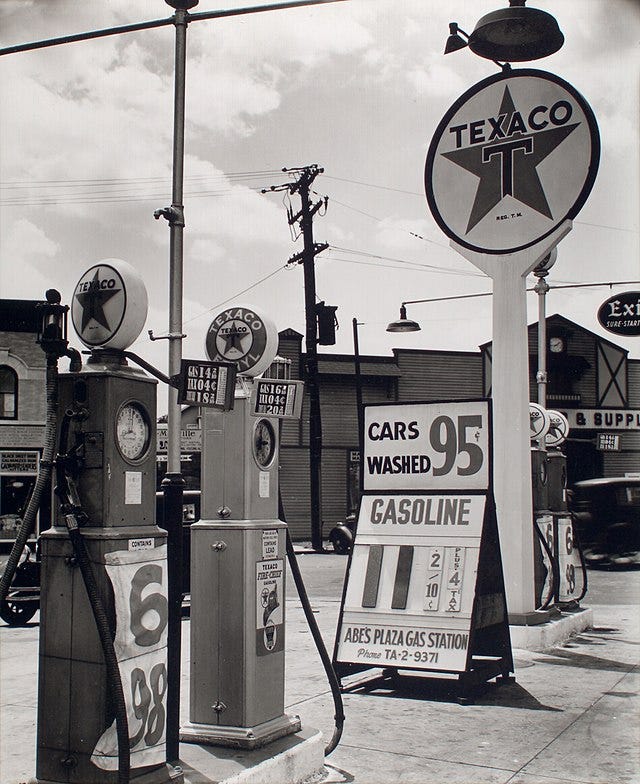
Texaco gas station in Bronx, New York (1936)
Along with many other consumer items, gasoline was heavily rationed during World War II. Those who were entitled to a few gallons could expect to pay around 21 cents per gallon. As World War II concluded in 1945, gasoline remained near 21 cents, rising to 23 cents in 1947 and 26 the next year.
Five years after World War II, in 1950, gasoline sold for an average of 27 cents per gallon (equivalent to about $3.29 in 2023 dollars.) At that time, the average household had an income of about $3,300 per year.
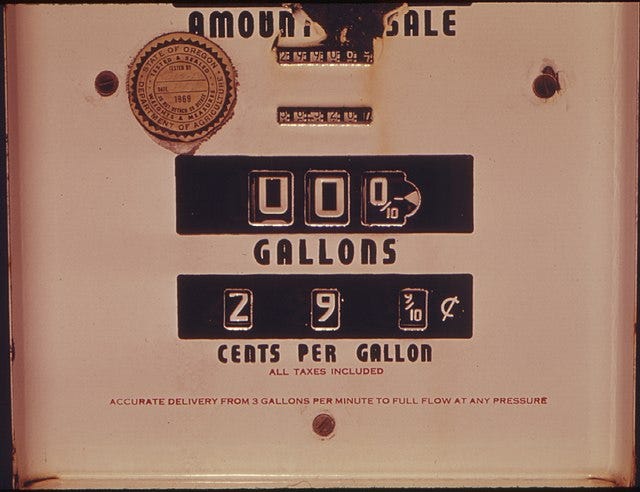
Gas pump in abandoned service station, photographed in 1974
Through the Fifties, a strong sales decade for automobile manufacturers, gasoline edged upward a bit, reaching 31 cents in 1957. The average price per gallon rose by less than a nickel during the Sixties as powerful V-8 engines, many of them installed in “muscle cars” aimed at youthful buyers, attracted greater attention. Average household income amounted to $5,600 in 1960, reaching about $6,900 in mid-decade.
At the same time, a new breed of compact cars, such as the Ford Falcon, Studebaker Lark, and Chevrolet Corvair promised markedly greater gas mileage in their attempt to capture a share of the vital suburban-homeowner market. Imported cars also were gaining a foothold in the U.S., ever since the first Volkswagen Beetle reached American shores back in 1949.
Suddenly, in 1973-74, the era of cheap gasoline screeched to a halt, due to the oil embargo established by the Organization of the Petroleum Exporting Countries (OPEC). That average gallon of gas, priced at a modest 39 cents in 1973, leaped to 57 cents a year later and kept on climbing, high-jumping to a whopping 90 cents at the end of the Seventies. Because of health concerns, leaded gasoline was outlawed in the mid-1970s, making only non-leaded fuel available at the nation’s service stations.
As the 1980s decade began, the average gasoline price not only passed the dollar-a-gallon mark, it reached a shocking $1.25. Measured in 2023 dollars, that was the equivalent of $4.43 a gallon. So, what had happened to those household incomes? They were rising rapidly, on average, from an average of $9,870 in 1970 to $13,720 in 1975 and more than $21,000 in 1980.
After hitting a peak of $1.38 gallon at the pump ($4.51 if measured in 2023 dollars) in 1981, gasoline prices began to ebb in the early Eighties. The biggest drop occurred in mid-decade, shrinking from $1.20 a gallon in 1985 to a satisfying 90 cents a year later. A couple of years after that, the price began to rise again, edging past the dollar-a-gallon figure in 1989. A brief dip took place in the mid-Nineties, dropping from $1.23 in 1997 to $1.06 the next year. As the new century began in 2000, though, the average pump price topped $1.50 a gallon.
The next big price change came in 2005, as the cost per gallon topped $2.00 for the first time (specifically $2.30, versus $1.88 in 2004). Passing the three-dollar milepost didn’t take long. In 2008 (the start of the Great Recession), to be exact, when the pump price averaged $3.27. That high was short-lived, though. Surprising even to those who followed the progress of the Recession, in 2009 the average shrunk by nearly a dollar, to a bargain-basement $2.35 per gallon.
That easing of cost lasted only two seasons. By 2011, the average price per gallon was back to pre-Recession level, at $3.53. Then, in 2015, motorists enjoyed another sharp price cut, as the average dipped to $2.45 (from $3.37 a year earlier). A sharp shock hit the gasoline market in 2021, as the average price jumped by 88 cents per gallon. Not shocking enough? In 2022, the average topped $4 a gallon for the first time, easing back to $3.50 during 2023.
Meanwhile, annual household incomes kept rising, from an average just under $30,000 in 1990 to more than $42,000 in 2000 and $50,000 in 2010. In 2022, the last year for which accurate figures are available, average household income topped $74,500.
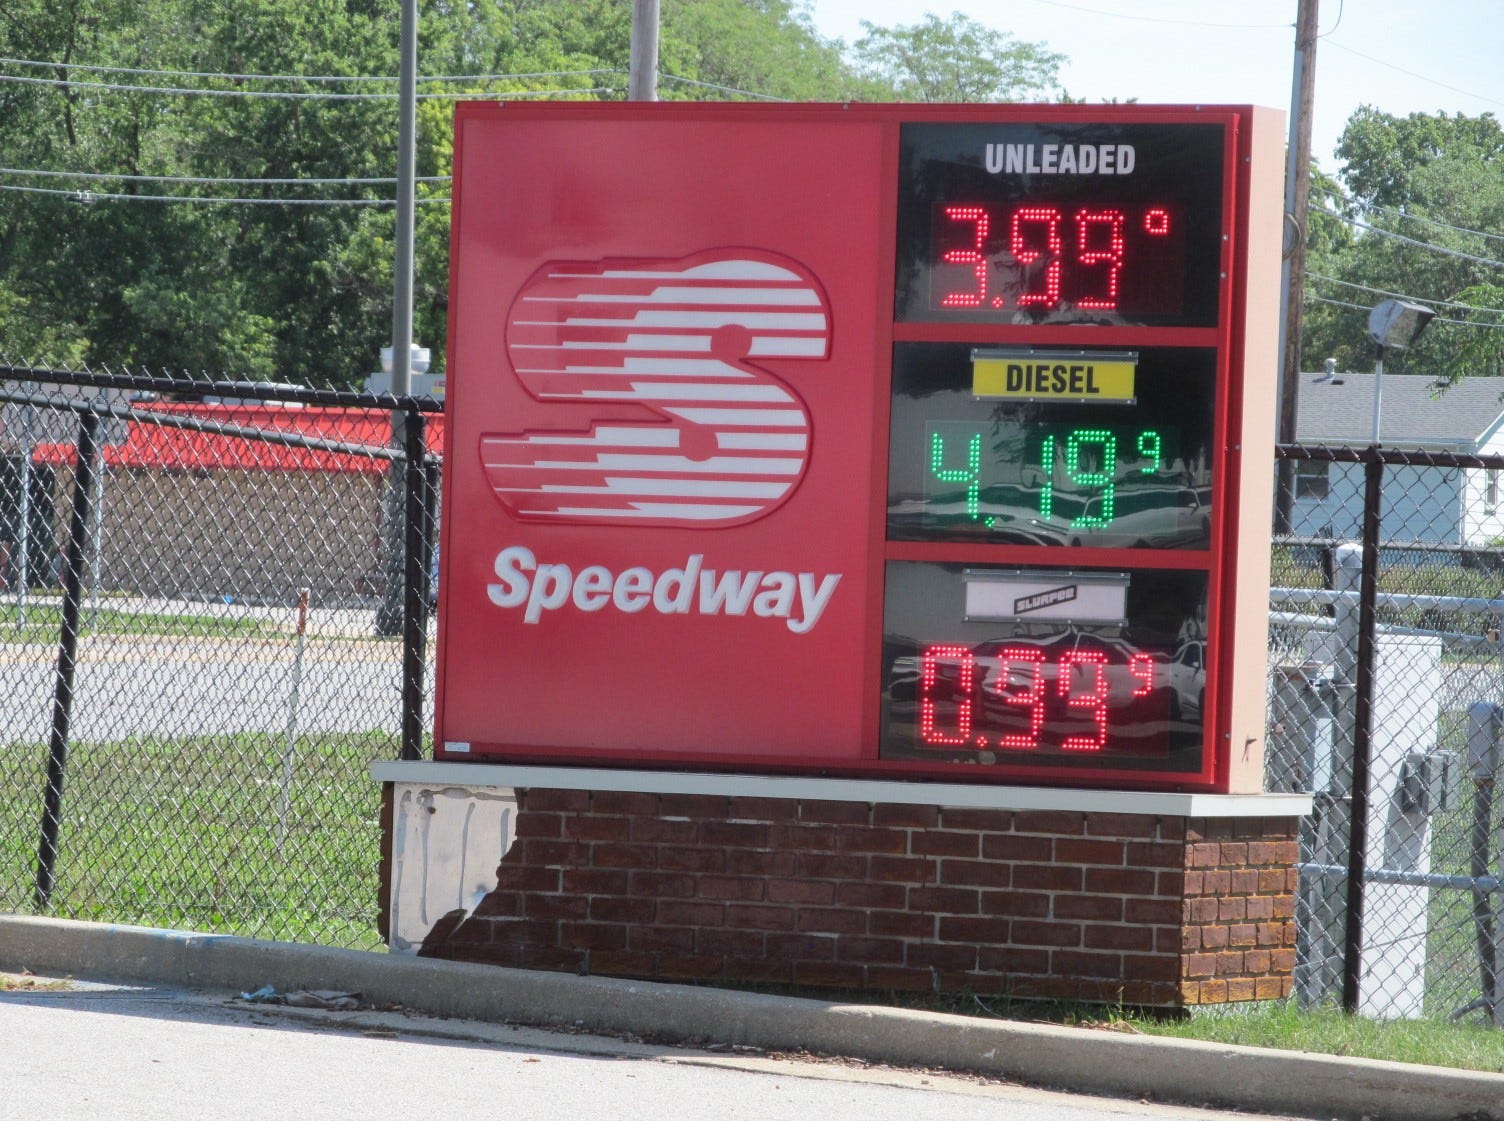
Service station sign (August 2024)
Various factors affect the rise and fall of gasoline prices. Shifting availability of oil, both domestic and from foreign sources, coupled with unpredictable per-barrel price changes, is a principal factor. Turmoil in the Middle East has been a major consideration for decades. In contrast to often-heard claims recently, especially from Republicans, most analysts do not place actions by the President and Congress near the top of that list of causes, though the impact of speculators is inevitably a consideration. So are geographic differences, as Californians typically face even higher costs than the rest of the nation.
Analysts have sometimes suggested that $5 is a transition point: the price that will cause drivers to buy smaller, more efficient automobiles, to drive more moderately, or simply cut down on driving. Evidence does not appear to bear out that prediction to a significant degree. For a while in 2024, as spring turned into summer, pump prices looked to be headed toward that summit. In some parts of the country, that $5 per gallon figure has been reached and exceeded more than once.
Of two things we can be sure:
1. Gasoline prices aren’t likely to drop appreciably anytime soon.
2. Complaints and anger about them will keep barging into the national conversation for a long time to come.
Note: Gasoline price data comes from EIA Monthly Energy Review. Household income averages are supplied by the U.S. Census Bureau. All prices are for regular-grade gasoline. Higher-octane fuel, often known as “Ethyl,” cost more. Household incomes are usually referred to in “average” number of dollars, though the Census bureau provides its figures in “median” dollars, which differ slightly.
© All contents copyright 2024 by James M. Flammang (Tirekicking Today)
Image Sources:
Gas station, 1936: Public Domain (Berenice Abbott – Wikimedia Commons)
Gas pump, 1974: Public Domain (The U.S. National Archives – David Falconer – Wikimedia Commons)
Price sign, 2024: James M. Flammang